Wells Dry, Fertile Plains Turn to Dust

HASKELL COUNTY, Kan. — Forty-nine years ago, Ashley Yost’s grandfather sank a well deep into a half-mile square of rich Kansas farmland. He struck an artery of water so prodigious that he could pump 1,600 gallons to the surface every minute.

Last year, Mr. Yost was coaxing just 300 gallons from the earth, and pumping up sand in order to do it. By harvest time, the grit had robbed him of $20,000 worth of pumps and any hope of returning to the bumper harvests of years past.

“That’s prime land,” he said not long ago, gesturing from his pickup at the stubby remains of last year’s crop. “I’ve raised 294 bushels of corn an acre there before, with water and the Lord’s help.” Now, he said, “it’s over.”

The land, known as Section 35, sits atop the High Plains Aquifer, a waterlogged jumble of sand, clay and gravel that begins beneath Wyoming and South Dakota and stretches clear to the Texas Panhandle. The aquifer’s northern reaches still hold enough water in many places to last hundreds of years. But as one heads south, it is increasingly tapped out, drained by ever more intensive farming and, lately, by drought.

Vast stretches of Texas farmland lying over the aquifer no longer support irrigation. In west-central Kansas, up to a fifth of the irrigated farmland along a 100-mile swath of the aquifer has already gone dry. In many other places, there no longer is enough water to supply farmers’ peak needs during Kansas’ scorching summers.

And when the groundwater runs out, it is gone for good. Refilling the aquifer would require hundreds, if not thousands, of years of rains.

This is in many ways a slow-motion crisis — decades in the making, imminent for some, years or decades away for others, hitting one farm but leaving an adjacent one untouched. But across the rolling plains and tarmac-flat farmland near the Kansas-Colorado border, the effects of depletion are evident everywhere. Highway bridges span arid stream beds. Most of the creeks and rivers that once veined the land have dried up as 60 years of pumping have pulled groundwater levels down by scores and even hundreds of feet.

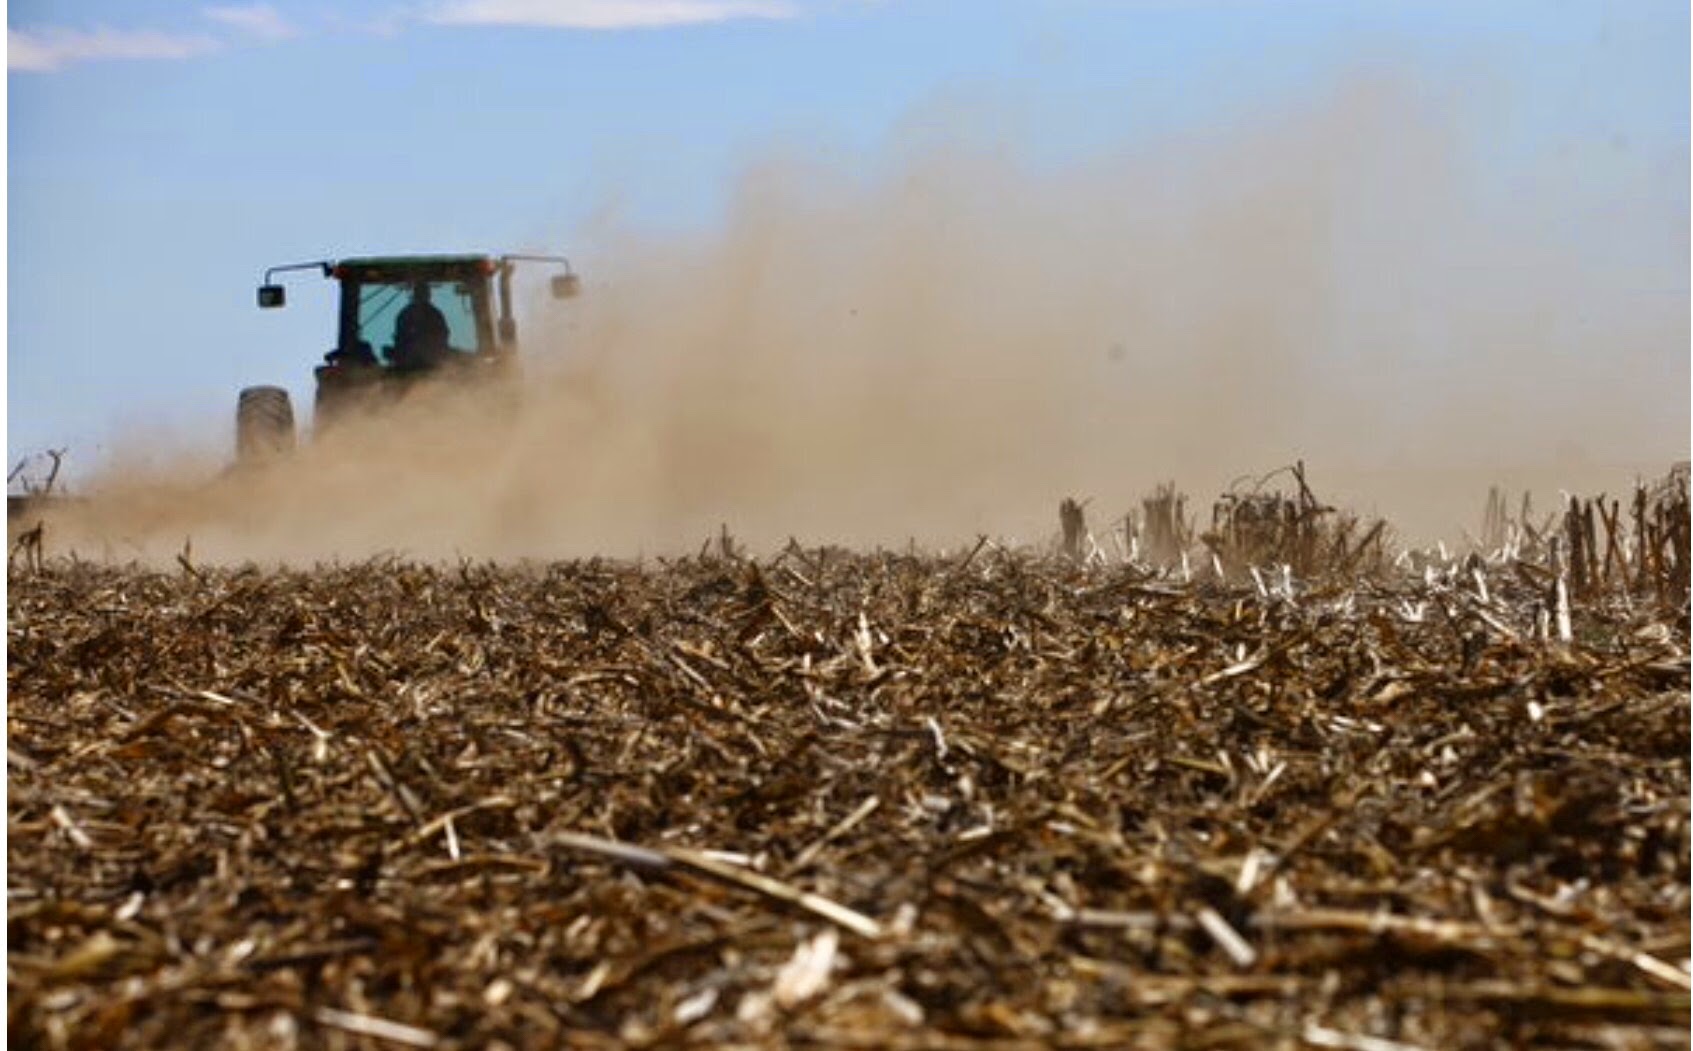
On some farms, big center-pivot irrigators — the spindly rigs that create the emerald circles of cropland familiar to anyone flying over the region — now are watering only a half-circle. On others, they sit idle altogether.

Two years of extreme drought, during which farmers relied almost completely on groundwater, have brought the seriousness of the problem home. In 2011 and 2012, the Kansas Geological Survey reports, the average water level in the state’s portion of the aquifer dropped 4.25 feet — nearly a third of the total decline since 1996.

And that is merely the average. “I know my staff went out and re-measured a couple of wells because they couldn’t believe it,” said Lane Letourneau, a manager at the State Agriculture Department’s water resources division. “There was a 30-foot decline.”

Kansas agriculture will survive the slow draining of the aquifer — even now, less than a fifth of the state’s farmland is irrigated in any given year — but the economic impact nevertheless will be outsized. In the last federal agriculture census of Kansas, in 2007, an average acre of irrigated land produced nearly twice as many bushels of corn, two-thirds more soybeans and three-fifths more wheat than did dry land.

Farmers will take a hit as well. Raising crops without irrigation is far cheaper, but yields are far lower. Drought is a constant threat: the last two dry-land harvests were all but wiped out by poor rains.

In the end, most farmers will adapt to farming without water, said Bill Golden, an agriculture economist at Kansas State University. “The revenue losses are there,” he said. “But they’re not as tremendously significant as one might think.”

Some already are. A few miles west of Mr. Yost’s farm, Nathan Kells cut back on irrigation when his wells began faltering in the last decade, and shifted his focus to raising dairy heifers — 9,000 on that farm, and thousands more elsewhere. At about 12 gallons a day for a single cow, Mr. Kells can sustain his herd with less water than it takes to grow a single circle of corn.

“The water’s going to flow to where it’s most valuable, whether it be industry or cities or feed yards,” he said. “We said, ‘What’s the higher use of the water?’ and decided that it was the heifer operation.”

The problem, others say, is that when irrigation ends, so do the jobs and added income that sustain rural communities.

“Looking at areas of Texas where the groundwater has really dropped, those towns are just a shell of what they once were,” said Jim Butler, a hydrogeologist and senior scientist at the Kansas Geological Survey.

The villain in this story is in fact the farmers’ savior: the center-pivot irrigator, a quarter- or half-mile of pipe that traces a watery circle around a point in the middle of a field. The center pivots helped start a revolution that raised farming from hardscrabble work to a profitable business.

Since the pivots’ debut some six decades ago, the amount of irrigated cropland in Kansas has grown to nearly three million acres, from a mere 250,000 in 1950. But the pivot irrigators’ thirst for water — hundreds and sometimes thousands of gallons a minute — has sent much of the aquifer on a relentless decline. And while the big pivots have become much more efficient, a University of California study earlier this year concluded that Kansas farmers were using some of their water savings to expand irrigation or grow thirstier crops, not to reduce consumption.

A shift to growing corn, a much thirstier crop than most, has only worsened matters. Driven by demand, speculation and a government mandate to produce biofuels, the price of corn has tripled since 2002, and Kansas farmers have responded by increasing the acreage of irrigated cornfields by nearly a fifth.

At an average 14 inches per acre in a growing season, a corn crop soaks up groundwater like a sponge — in 2010, the State Agriculture Department said, enough to fill a space a mile square and nearly 2,100 feet high.

Sorghum, or milo, gets by on a third less water, Kansas State University researchers say — and it, too, is in demand by biofuel makers. As Kansas’ wells peter out, more farmers are switching to growing milo on dry land or with a comparative sprinkle of irrigation water.

But as long as there is enough water, most farmers will favor corn. “The issue that often drives this is economics,” said David W. Hyndman, who heads Michigan State University’s geological sciences department. “And as long as you’ve got corn that’s $7, then a lot of choices get made on that.”

Of the 800 acres that Ashley Yost farmed last year in Haskell County, about 70 percent was planted in corn, including roughly 125 acres in Section 35. Haskell County’s feedlots — the county is home to 415,000 head of cattle — and ethanol plants in nearby Liberal and Garden City have driven up the price of corn handsomely, he said.

But this year he will grow milo in that section, and hope that by ratcheting down the speed of his pump, he will draw less sand, even if that means less water, too. The economics of irrigation, he said, almost dictate it.

“You’ve got $20,000 of underground pipe,” he said. “You’ve got a $10,000 gas line. You’ve got a $10,000 irrigation motor. You’ve got an $89,000 pivot. And you’re going to let it sit there and rot?

“If you can pump 150 gallons, that’s 150 gallons Mother Nature is not giving us. And if you can keep a milo crop alive, you’re going to do it.”

Mr. Yost’s neighbors have met the prospect of dwindling water in starkly different ways. A brother is farming on pivot half-circles. A brother-in-law moved most of his operations to Iowa. Another farmer is suing his neighbors, accusing them of poaching water from his slice of the aquifer.

A fourth grows corn with an underground irrigation system that does not match the yields of water-wasting center-pivot rigs, but is far thriftier in terms of water use and operating costs.

For his part, Mr. Yost continues to pump. But he also allowed that the day may come when sustaining what is left of the aquifer is preferable to pumping as much as possible.

Sitting in his Ford pickup next to Section 35, he unfolded a sheet of white paper that tracked the decline of his grandfather’s well: from 1,600 gallons a minute in 1964, to 1,200 in 1975, to 750 in 1976.

When the well slumped to 500 gallons in 1991, the Yosts capped it and drilled another nearby. Its output sank, too, from 1,352 gallons to 300 today.

This year, Mr. Yost spent more than $15,000 to drill four test wells in Section 35. The best of them produced 195 gallons a minute — a warning, he said, that looking further for an isolated pocket of water would be costly and probably futile.

“We’re on the last kick,” he said. “The bulk water is gone.” More


Signs of stress must not be ignored, IEA warns in its new World Energy Outlook

Energy sector must tackle longer-term pressure points before they reach breaking point

Events of the last year have increased many of the long-term uncertainties facing the global energy sector, says the International Energy Agency’s (IEA) World Energy Outlook 2014 (WEO-2014). It warns against the risk that current events distract decision makers from recognising and tackling the longer-term signs of stress that are emerging in the energy system.

In the central scenario of WEO-2014, world primary energy demand is 37% higher in 2040, putting more pressure on the global energy system. But this pressure would be even greater if not for efficiency measures that play a vital role in holding back global demand growth. The scenario shows that world demand for two out of the three fossil fuels – coal and oil – essentially reaches a plateau by 2040, although, for both fuels, this global outcome is a result of very different trends across countries. At the same time, renewable energy technologies gain ground rapidly, helped by falling costs and subsidies (estimated at $120 billion in 2013). By 2040, world energy supply is divided into four almost equal parts: low-carbon sources (nuclear and renewables), oil, natural gas and coal.

In an in-depth focus on nuclear power, WEO-2014 sees installed capacity grow by 60% to 2040 in the central scenario, with the increase concentrated heavily in just four countries (China, India, Korea and Russia). Despite this, the share of nuclear power in the global power mix remains well below its historic peak. Nuclear power plays an important strategic role in enhancing energy security for some countries. It also avoids almost four years’ worth of global energy-related carbon-dioxide (CO2) emissions by 2040. However, nuclear power faces major challenges in competitive markets where there are significant market and regulatory risks, and public acceptance remains a critical issue worldwide. Many countries must also make important decisions regarding the almost 200 nuclear reactors due to be retired by 2040, and how to manage the growing volumes of spent nuclear fuel in the absence of permanent disposal facilities.

“As our global energy system grows and transforms, signs of stress continue to emerge,” said IEA Executive Director Maria van der Hoeven. “But renewables are expected to go from strength to strength, and it is incredible that we can now see a point where they become the world’s number one source of electricity generation.”

The report sees a positive outlook for renewables, as they are expected to account for nearly half of the global increase in power generation to 2040, and overtake coal as the leading source of electricity. Wind power accounts for the largest share of growth in renewables-based generation, followed by hydropower and solar technologies. However, as the share of wind and solar PV in the world’s power mix quadruples, their integration becomes more challenging both from a technical and market perspective.

World oil supply rises to 104 million barrels per day (mb/d) in 2040, but hinges critically on investments in the Middle East. As tight oil output in the United States levels off, and non-OPEC supply falls back in the 2020s, the Middle East becomes the major source of supply growth. Growth in world oil demand slows to a near halt by 2040: demand in many of today’s largest consumers either already being in long-term decline by 2040 (the United States, European Union and Japan) or having essentially reached a plateau (China, Russia and Brazil). China overtakes the United States as the largest oil consumer around 2030 but, as its demand growth slows, India emerges as a key driver of growth, as do sub-Saharan Africa, the Middle East and Southeast Asia.

“A well-supplied oil market in the short-term should not disguise the challenges that lie ahead, as the world is set to rely more heavily on a relatively small number of producing countries,” said IEA Chief Economist Fatih Birol. “The apparent breathing space provided by rising output in the Americas over the next decade provides little reassurance, given the long lead times of new upstream projects.”

Demand for gas is more than 50% higher in 2040, and it is the only fossil fuel still growing significantly at that time. The United States remains the largest global gas producer, although production levels off in the late-2030s as shale gas output starts to recede. East Africa emerges alongside Qatar, Australia, North America and others as an important source of liquefied natural gas (LNG), which is an increasingly important tool for gas security. A key uncertainty for gas outside of North America is whether it can be made available at prices that are low enough to be attractive for consumers and yet high enough to incentivise large investments in supply.

While coal is abundant and its supply relatively secure, its future use is constrained by measures to improve efficiency, tackle local pollution and reduce CO2 emissions. Coal demand is 15% higher in 2040 but growth slows to a near halt in the 2020s. Regional trends vary, with demand reaching a peak in China, dropping by one-third in the United States, but continuing to grow in India.

The global energy system continues to face a major energy poverty crisis. In sub-Saharan Africa (the regional focus of WEO-2014), two out of every three people do not have access to electricity, and this is acting as a severe constraint on economic and social development. Meanwhile, costly fossil-fuel consumption subsidies (estimated at $550 billion in 2013) are often intended to help increase energy access, but fail to help those that need it most and discourage investment in efficiency and renewables.

A critical “sign of stress” is the failure to transform the energy system quickly enough to stem the rise in energy-related CO2 emissions (which grow by one-fifth to 2040) and put the world on a path consistent with a long-term global temperature increase of 2°C. In the central scenario, the entire carbon budget allowed under a 2°C climate trajectory is consumed by 2040, highlighting the need for a comprehensive and ambitious agreement at the COP21 meeting in Paris in 2015.

The World Energy Outlook is for sale at the IEA bookshop. Journalists who would like more information should contact ieapressoffice@iea.org.

Download the following resources:

About the IEA

The International Energy Agency is an autonomous organisation that works to ensure reliable, affordable and clean energy for its 29 member countries and beyond. Founded in response to the 1973/4 oil crisis, the IEA’s initial role was to help countries co-ordinate a collective response to major disruptions in oil supply. While this remains a key aspect of its work, the IEA has evolved and expanded. It is at the heart of global dialogue on energy, providing authoritative research, statistics, analysis and recommendations.

Alternative Download


Reducing European Dependence on Russian Gas

Executive Summary

The main finding of this paper is that there is limited scope for significantly reducing overall European dependence on Russian gas before the mid-2020s.

However, countries in the Baltic region and south-eastern Europe which are highly dependent on Russian gas, and hence extremely vulnerable to interruptions, could substantially reduce and even eliminate imports of Russian gas by the early 2020s, by a combination of LNG supplies and pipeline gas from Azerbaijan. Similar measures could reduce (but not eliminate) the dependence of central Europe and Turkey on Russian gas. In the majority of countries, there is limited scope to reduce gas with oil products, and to the extent that it is replaced by coal in power generation carbon emissions will increase significantly.

Up to the mid-2020s, European companies are contractually obliged to import at least 115 bcm/year of Russian gas (approximately 75 per cent of the 2013 import level), a figure which reduces to around 65 bcm by 2030. Even if long-term contracts disappear, our modelling shows a requirement of at least 100 bcm/year of Russian gas up to 2030, and in some scenarios up to twice that volume. The main additional source of non-Russian gas for Europe up to 2030 will be LNG; pipeline gas imports from domestic and other imported sources are not envisaged to increase substantially and may decline. Russian gas deliveries to Europe will be highly competitive with all other pipeline gas and LNG (including US LNG) supplies throughout the period to 2030, and Gazprom's market power to impact European hub prices may be considerable.

Countries with strong geopolitical fears related to Russian gas dependence will need to either terminate, or not renew on expiry, their long-term contracts with Gazprom. This will result in substantial additional infrastructure costs for LNG import terminals and pipeline connections, or investments in alternative energy sources, energy conservation, and efficiency measures.

Whatever the political relationship between Russia, the European Union, and individual European countries, a continued natural gas relationship will be necessary and needs to be carefully managed. The most immediate problems are: a resolution of the Ukrainian transit situation, and a successful conclusion of the EU's regulatory treatment of the South Stream pipeline. Once the immediate crisis has passed, both sides need to discuss the future role of gas in EU energy balances, together with its potential contribution to the EU's ambitious carbon reduction targets. Download PDF


Climate change and smart grid? There are more linkages than you think

When you think of climate change and energy, what springs to mind? Coal, fossil fuel, power plants, renewables, and efficiency are likely on your list, whether as contributors or mitigation options. But if demand response and smart grid are not on your list, it is incomplete.

Smart Grid

You are not alone. The EPA didn’t put them on its “list” when it put out its draft Clean Power Plan (111d) earlier this year. The fact is, however, that smart grid and things under its umbrella like DR, storage, etc. should be squarely on the table when climate-related plans are being made.

There are three questions regarding smart grid and climate change that are being asked these days. There is also one question that is not being asked but should be. They will all be part of the discussion at the upcoming National Summit on Smart Grid and Climate Change on December 2-3, but let’s take a quick look at them now.

The first two are:

  1. Can states use smart grid (and anything like DR, storage, etc that is under its umbrella) in their compliance plans under the EPA Clean Power Plan (111d)?
  2. If the answer to the first question is yes, will that give a boost to smart grid activity?

The third one is:

3. Which should happen first? Grid Hardening or Grid “Smartening”? Or should they be done together?

The first two questions fall into the category of climate mitigation and emissions reduction. Even before the EPA Plan came out, smart grid and DR were not seen as saving kWh, and therefore emissions. They were focused on kW reduction, and only for short amounts of time, usually on peak, right?

Well, that may have been true once, but that is not the case anymore. DR is no longer just about the peak. It has evolved into technology-based intelligent energy management. It has become dynamic efficiency, as opposed to traditional end-use efficiency. As such, it optimizes and reduces energy consumption and emissions. But even where DR is used solely as a peak management tool, studies show that there is little if any “bounce back” effect during the off-peak( i.e. not all of the usage that was reduced is replaced) and that on average there is a 4-5% overall reduction.

Let’s look at another smart grid option – Conservation Voltage Reduction (CVR). This option is essentially one where smart grid technology allows a utility to provide the same service to the customer while also lowering voltage, which in turn lowers usage and therefore emissions. CVR has been shown to generate around 1% savings, and customers don’t have to do anything.

Thankfully, with a little prodding by the SG and DR community, EPA has seen the light and now commonly speaks out to say that smart grid is definitely eligible for states to consider putting in their 111d compliance plans. EPA has clarified that the four specified “building blocks” in its plan were for purposes of determining goals. They are not prescriptive choices. States can put anything they want to in their plan, as long as they demonstrate that there will be reductions.

So that brings us to question 2 – what does that mean for smart grid? Well, if it is eligible to be used in a state plan, that should be good, right? Not necessarily. First, the people putting together the state plans need to not be hung up on the myth that there are no reductions from smart grid. EPA saying it is eligible only means it is on the shopping list for states. The key is getting them to select it, and that may take a focused education effort on the part of the smart grid and DR community. And it wouldn’t hurt if as part of that effort, states were reminded that they can’t plan to do large amounts of intermittent renewables on the system and not think about DR and smart grid – yet another reason to put them into a plan.

Finally, let’s examine question 3on climate adaptation. Whatever climate change scenario one subscribes to, few if any speak out against the need to prepare for change, whether it is sea level rise, storms, or rising temperatures. So is there a role for smart grid? At the National Summit on Smart Grid and Climate Change, an entire track has been devoted to that discussion.

When it comes to the electricity system, resiliency is the word one hears most. While definitions of that differ, two of the common attributes of a resilient system are flexibility and diversity. That means not putting all of your eggs into one power system, or one line. It means seeking strength through a distribution system that is really distributed – not just for delivery of power, but for generating it. That is where distributed energy resources (DER) and microgrids – both part of the smart grid diaspora – come into play. They help increase the resiliency of a system. Of course such a system needs management. But that is where the new smart grid technologies provide the ability to sense, monitor, communicate, and control.

The challenge in the question is this: some grid resiliency efforts in the wake of Superstorm Sandy and other similar events are focusing on grid hardening – not grid smartening. Now I agree that grid hardening sounds conceptually comforting. After all, raising the level of a substation so that storm waters will flow underneath it (a real example) is pretty straightforward and understandable. But where does that get us in the end? How has that modernized the grid? Don’t get me wrong, I believe that grid hardening should be pursued where it makes sense, but not at the total exclusion of grid smartening.

In an ideal world, states would be looking at a climate adaption plan at the same time they are putting together a climate mitigation plan. In that ideal world, smart grid would get bonus points for being something that can go into both plans. But we don’t live in an ideal world, and state agencies operate in silos. It may be up to the DR and smart grid communities to help them with their plans, and help them connect the dots that will make those plans better and create better opportunities for smart grid. More


World on the brink of oil war as Opec bickers over price

Oil prices ended last week in freefall as the world’s largest group of producers from petro-states in the Middle East dithered over whether to cut output.

A secretive group of the world’s most powerful oil ministers will soon gather in Vienna to take arguably one of the most important decisions that could affect the still fragile world economy: whether to cut production of crude to defend prices at $100 per barrel, or keep open the spigots as winter looms among the biggest energy-consuming nations?

A sudden slump in the price of crude has exposed deep divisions within the Organisation of Petroleum Exporting Countries (Opec) ahead of its final scheduled meeting of the year next month to decide on how much oil to pump.

Some members, led by Iran, have called for immediate action to stem the drop in oil prices, while the Arab sheikhdoms of the Gulf have so far argued that it could be another three months before it becomes clear whether the group should cut production for the first time since December 2008.

Whatever they decide, oil remains the lifeblood of the global economic system due to its direct impact on inflation and input prices. Brent crude – a global benchmark of oil drawn from 15 fields in the North Sea, dipped last week to multi-year lows below $92 per barrel as a perfect storm of a strong US dollar, oversupply in the system and declining demand shattered confidence in the market. Brent has tumbled 20pc in the last three months after touching $115 per barrel in June.

In the US – the world’s biggest consumer – crude for November delivery at one point last week dropped below the psychologically important $90 pricing level, raising fears that a prolonged slump could put many of America’s shale drillers out of business. Shale oil, which can cost up to $80 per barrel to produce, has spurred an energy revolution in the US, which has started to threaten the dominance of producers in the Middle East.

However, at current price levels many of these new so called “tight oil” wells are approaching the point when they will soon become unprofitable.

Like the situation in the US, falling oil prices are also a double-edged sword for Britain’s economy and investors. Although George Osborne, the Chancellor, is less reliant on tax revenues from the North Sea than some of his predecessors, prices are approaching the point when many of the developments planned offshore west of Shetland by international oil companies could be placed on ice.

A sharp drop-off in domestic oil production and associated tax receipts from the North Sea would give Mr Osborne an unwelcome hole to fill in the government’s public finances heading into next year’s general election. However, falling oil prices will help to keep inflation low.

For Britain’s motorists the current declines have been good news that has trickled through to the price of petrol on forecourts. A litre of unleaded petrol in the UK has fallen a few pence over the past month to an average of around 127.21p on average, a figure last seen in 2011, just before Mr Osborne raised the value added tax on fuel to 20pc, from 17.5pc.

All eyes are now firmly focused on the next move by Opec, which controls 60pc of the world’s oil reserves and about a third of daily physical supply. The group has been branded an unaccountable “cartel” by free-market critics in North America who claim its system of limiting production by setting an output ceiling and quotas is tantamount to price rigging.

Although this is an accusation that the group’s secretariat which is based in Vienna strongly denies, its mostly unelected group of policymaking oil ministers undeniably pull the strings of the global energy industry in the same way that central bankers can control currencies.

Opec states have largely managed to maintain cohesion over the last decade as prices over $100 per barrel have enriched their economies and encouraged adherence to quotas. This consensus is now starting to break down, creating more uncertainty in the market and a potentially destabilising situation for the global economy.

Next month’s meeting promises to be the most tense held since the onset of the Arab Spring in 2010, with the Shi’ite Muslim faction of Iran and Iraq already appearing to line up against Saudi Arabia and the United Arab Emirates (UAE).

Iran’s Oil Minister Bijan Zanganeh has placed his cards on the table early by calling for Opec to urgently cut output to stem the sharp recent decline in prices, which threatens the Islamic Republic’s fragile economy after years of restrictive sanctions.

According to research from Deutsche Bank, Iran has the highest fiscal break-even price for its budget at over $130 per barrel of Brent, compared with the UAE at around $70 per barrel and Saudi Arabia at about $90. More


Solar power could be world’s top electricity source by 2050

Solar energy could be the top source of electricity by 2050, aided by plummeting costs of the equipment to generate it, a report from the International Energy Agency (IEA), the West’s energy watchdog, said on Monday.

IEA Reports said solar photovoltaic (PV) systems could generate up to 16% of the world’s electricity by 2050, while solar thermal electricity (STE) – from “concentrating” solar power plants – could provide a further 11%.

“The rapid cost decrease of photovoltaic modules and systems in the last few years has opened new perspectives for using solar energy as a major source of electricity in the coming years and decades,” said IEA Executive Director Maria van der Hoeven.

Solar photovoltaic (PV) panels constitute the fastest-growing renewable energy technology in the world since 2000, although solar is still less than 1% of energy capacity worldwide.

The IEA said PV expansion would be led by China, followed by the United States, while STE could also grow in the United States along with Africa, India and the Middle East. More


The Peak Oil Crisis: It‘s All Around Us

Ten years ago peak oil was assumed to be a rather straight forward, transparent process. What was then thought of as “oil” production was going to stop growing around the middle of the last decade.


Shortages were going to occur; prices were going to rise; demand was going to drop; economies would falter; and eventually a major economic depression was going to occur. Fortunately or not, depending on your point of view, the last ten years have turned out to a lot more complicated than expected. Production of what is now known as “conventional” oil did indeed peak back around 2005, and many of the phenomena that were expected to result did occur and continue to this day.

Oil prices have climbed several-fold from where they were in the early years of the last decade – surging upwards from $20 a barrel to circa $100. This rapid jump in energy costs did slow many nations’ economies, cut oil consumption, and with some other factors set off a “great” recession. Real economic hardships have not yet occurred

What is so interesting about all this is that a temporary surge in what was heretofore a little known source of oil in the U.S. is masking the larger story of what is taking place in the global oil situation

Much of this is due to the reaction that set in from high oil prices and increased government intervention into the economy. In the case of the U.S., Washington turned on the modern day equivalent of the printing presses and began handing out money that was used to develop expensive sources of oil and gas. The high selling price per barrel, coupled with cheap money led to a boom in U.S. oil production where fortuitous geological conditions in North Dakota and South Texas allowed the production of shale oil at money-making prices provided oil prices stay high.

U.S. unconventional oil production soared by some 3.3 million barrels a day (b/d) in the last four years, and, if the US Energy Information Administration is correct, is due to climb by another million b/d or so in 2015. While this jump in production was unexpected by most, it was just another phenomenon resulting from unprecedentedly high oil prices, which in turn resulted from the lack of adequate “conventional” oil production. As is well known, economic development can have major reactions and feedbacks

What is so interesting about all this is that a temporary surge in what was heretofore a little known source of oil in the U.S. is masking the larger story of what is taking place in the global oil situation. The simple answer is that except for the U.S. shale oil surge almost no increase in oil production is taking place around the world. No other country as yet has gotten significant amounts of shale oil or gas into production. Russia’s conventional oil production seems to be peaking at present, and its Arctic oil production is still many years, or perhaps even decades, away. Brazilian production is going nowhere at the minute, deepwater production in the Gulf of Mexico is stagnating and the Middle East is busy killing itself. On top of all this, global demand for oil continues to increase by some million b/d each year – most of which is going to Asia.

If we step back and acknowledge that the shale oil phenomenon will be over in a couple of years and that oil production is dropping in the rest of the world, then we have to expect that the remainder of the peak oil story will play out shortly. The impact of shrinking global oil production, which is been on hold for nearly a decade, will appear. Prices will go much higher, this time with lowered expectations that more oil will be produced as prices go higher. The great recession, which has never really gone away for most, will return with renewed vigor and all that it implies.

An additional factor which has grown considerably worse in the last ten years is climate change, largely brought about by the combustion of fossil fuels. We are already seeing global weather anomalies with record high and low temperatures and record floods as well as droughts. This too will take its toll on economic development as mitigating this change will soon become enormously expensive. We are already seeing migrations of restive peoples. Thousands are dying in efforts to get from the Middle East and Africa into the EU. Millions are already homeless across the Middle East and recent developments foretell hundreds of thousands if not millions more being added to ranks of refugees as decades and even centuries-old political arrangements collapse.

All this is telling us that the peak oil crisis we have been watching for the last ten years has not gone away, but is turning out to be a more prolonged event than previous believed. Many do not believe that peak oil is really happening as they read daily of surging oil production and falling oil prices. Rarely do they hear that another shoe has yet to drop and that much worse in terms of oil shortages, higher prices and interrupted economic growth is just ahead.

We are sitting in the eye of the peak oil crisis and few recognize it. Five years from now, it should be apparent to all. More


Ongoing drought in Brazil brings rising tensions

The western USA is not the only place suffering from lack of rain, Latin America’s economic powerhouse has been struck hard by a powerful and ongoing water crisis.

The worst drought since records began 84 years ago has constrained the Brazillian economy in many ways, particularly coffee production, agriculture and hydroelectric power generation, which accounted for 80% of electricity generation. This power fuels the economic development on which millions are counting to rise out of poverty, and the loss has slowed the entire economy, due to the need to import expensive fossil fuels in order to keep the lights on and water pumps running (costing $6 billion extra so far this year, while increasing the country’s greenhouse gas emissions).


Water rationing has been imposed in many parts of the country for months, but the situation is approaching a critical point. Nineteen large cities are under water rationing rules, and the water catchment capacity feeding the megalopolis of Sao Paolo (20 million inhabitants and the economic capital of the entire continent) is down to 10%. Carefully husbanded, and tapping water usually deemed of inferior quality, there is enough left to squeeze out of the system for a hundred days consumption. States are now squabbling over allocation of the remaining water resources, and fighting has erupted sporadically in some rural areas.

In Sao Paolo itself, financial incentives to reduce consumption have been accompanied by cutting water pressure at night, effectively cutting off all the poorer areas of the city which sit on hills. In nearby Gaurulhos residents of some neighbourhoods are getting water one day in three. Balancing the competing needs of drinking water and power generation is also having societal consequences, exacerbating general social tension, and helping fuel reactions such as the protests and riots back in June.

The drought may be linked to climate change, since the rains that normally come south from evaporation in the Amazon basin failed to arrive, a potentially very worrying symptom. It also reveals some of the likely types of economic cost and societal tension that will arise and worsen as the world warms further and the consequences begin to bite. Some early spring rains appeared in Brazil this week, enough at least to halt the fall in Sao Paolo’s reserves, but the prognosis for the coming rainy season is still very uncertain.

Via Facebook –The Earth Story

Image credit: Reuters/Nacho Doce

http://www.theguardian.com/weather/2014/sep/05/brazil-drought-crisis-rationing
http://www.reuters.com/article/2014/02/12/us-brazil-economy-fiscal-idUSBREA1B1CY20140212
http://phys.org/news/2012-05-worst-drought-years-toll-northern.html


NOTICE OF INTENT TO FINALIZE THE TERMS OF REFERENCE FOR THE PROPOSED OCEAN THERMAL ENERGY CONVERSION PROJECT

REQUEST FOR COMMENTS AND NOTICE OF PUBLIC MEETING

The Environmental Assessment Board (EAB) is providing Notice to the Public of the publication of the Draft Terms of Reference (ToR) for the Environmental Impact Assessment (EIA) for a proposed Ocean Thermal Energy Conversion (OTEC) Project on the north shore of Grand Cayman. The public is invited to review and comment on the To R which has been developed in collaboration with the EAB, which includes representatives from the Department of Environment, Planning Authority. Port Authority, and the Electricity Regulatory Authority.

The prolect Proponent. OTEC international. LLC (OTI) ie undertaking an EIA for its proposed phased installation of 25 megawatts (MWe) of power. The Initial phase would be a 6.25Mwe floating power platform (FPP). The result of the ElA will be an Environmental Statement (ES) which will help to inform the decision-making process. Download PDF

Yo u r input will be considered in the finalization of the To R document which is available oniine at www.doe.ky or hard copies can be reviewed at the following locations:

1. Government Administration Building. 133 Elgin Avenue, George Town

2. George Town Public Library. 68 Edward Street

3. North Side Post Office. 896 North Side Road

Comments on the draft TOR may be submitted:

1) in writing during the public meeting.

2) electronically via e-mail to doe@gov.ky

3) mailed to Department of Environment, P.0. Box 10202. Grand Cayman, KY1-1002

4) hand delivered, in writing, to Department of Environment, Environmental Centre, 580 North Sound Road, George Town , Grand Cayman.

A public meeting will be held on Tuesday 23 September 2014 at the North Side Civic

centre to provide an opportunity for OTI and the EIA Consultant to outline the project and to invite comments and questions from the Public on the draft ToR. Representatives from OTI, the EIA Consultant and the EAB will be available to provide information and receive comments concerning the ToR . The presentation will commence at 7:30 p.m. and will be followed by a question and answer session at 8:00 p.m.

The period for written comments on the draft ToR opens on Friday 12 September for a duration of 21 days and will officially close at midnight on Friday 3 October 2014.


ECLAC, CARICOM Highlight Vulnerabilities, Opportunities in Caribbean SIDS

3 September 2014: During a side event at the Third International Conference on Small Island Developing States (SIDS), representatives of Caribbean SIDS and the UN discussed critical factors that underpin the vulnerability of Caribbean SIDS.


‘The vulnerability of Caribbean SIDS revisited – it's all about size' took place in Apia, Samoa, on 3 September 2014, and was organized by the Economic Commission for Latin America and the Caribbean (ECLAC) in collaboration with the Caribbean Community (CARICOM) Secretariat.


Speakers discussed trade and finance, governance and institutional capacity, disaster management, regional integration and opportunities arising from the small size of SIDS, as well as the fact that the majority of Caribbean SIDS are classified as middle-income countries, based on gross domestic product (GDP).


Raúl García-Buchaca, ECLAC, said middle-income status based on GDP fails to consider inequalities at the national level. John Ashe, President of the UN General Assembly (UNGA), focused on the particular vulnerabilities of Caribbean SIDS, and suggested mainstreaming them into the post-2015 development agenda. Winston Dookeran, Minister of Foreign Affairs, Trinidad and Tobago, called for working with development partners and international financial institutions to build buffers to external shocks, and declared that “Size may well be an opportunity rather than a limitation.”


Carolyn Rodrigues-Birkett, Minister of Foreign Affairs, Guyana, said the Caribbean would require over 7% growth to be sustainable, and mentioned the challenge in diversifying Caribbean economies within the new global economic order. Camillo Gonsalves, Minister of Foreign Affairs, Saint Vincent and the Grenadines, said that because of their small GDP, SIDS are unable to finance adaptation and recovery from natural disasters, and recommended regional integration, development financing, preferential trade, and debt relief and restructuring to assist in this regard.


Participants also introduced a vulnerability-resilience profile for arriving at an index, said the SIDS resilience fund could be a good measure in this regard, and underscored that the human capital must be recognized, public policy revolutionized, and political structure transformed. [ECLAC Press Release] [Statement of UNGA President] More