


Above, NOAA has published a graph of modeling predictions from various professional groups looking at the developing El Nino event in the Pacific.
The dark line that starts at the left is actual observations of what we see so far in unusually warm surface water in the central and eastern pacific. The various colored lines that proceed to the right are the different attempts at predictions. As you can see, they are running hot – very hot, to the point of sailing off the top of the chart…
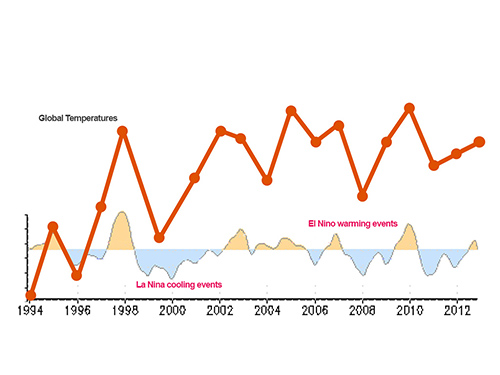
As you can see from this diagram, global temperatures tend to get a bounce in El Nino years, while La Nina years exert a cooling influence.
EL NIÑO is Spanish for…The Niño!” joked Chris Farley on a 1997 episode of Saturday Night Live, a sketch comedy programme. The skit was memorable for its absurdity but it did not do much to explain…
View original post 210 more words
